DataUptoPakistan Careers

Learn. Build. Analyze. Grow.

Your future in data starts here.

Explore free career roadmaps, practical learning resources, interview questions, datasets and mentor-supported training programs designed to help you move toward a career in data.

Build your resume free
ExcelSQLPower BIPythonTableauStatisticsMachine LearningAirflowdbtSparkCloudExcelSQLPower BIPythonTableauStatisticsMachine LearningAirflowdbtSparkCloud

Choose your career path

Three career paths. Two phases each.

Every roadmap is split into Phase 1 (Foundations) and Phase 2 (Intermediate & Advanced). Durations are suggested learning timelines — actual time depends on your prior knowledge, study hours and practice.

The DataUpto journal

Your free starting point.

Detailed roadmaps, practical projects and curated lessons. Start with the three data careers.

Explore all articles

Complete free roadmap

The full Data Analyst roadmap — 3 months, 2 phases.

Phase 1 builds your foundations; Phase 2 takes you to intermediate and advanced level. Click through each stage to see exactly what to learn, tool by tool.

P1 Foundations
P2 Intermediate & Advanced

Stage 1: Understand data and spreadsheets

Weeks 1–2

Phase 1 — Foundations — Build the base: spreadsheets, SQL and the statistics every analyst relies on. By the end of this phase you can clean data, query databases and explain numbers with confidence.

What you'll learn in each tool

Excel

  • Interface, worksheets and cell references
  • Core formulas: SUM, AVERAGE, IF, SUMIF, COUNTIF
  • VLOOKUP / XLOOKUP for combining tables
  • Pivot tables and pivot charts
  • Data cleaning: trim, dedupe, text-to-columns
  • Building a simple one-page dashboard

Analytical thinking

  • Turning a business question into a data question
  • Reading a table before touching a formula
  • Spotting errors, duplicates and outliers

Topics

What data analysts actually do day to dayAnalytical thinking and asking the right questionsStructured vs unstructured dataRows, columns, records and variablesData types and why they matterBasic descriptive statisticsSorting, filtering and conditional formattingIF, SUMIF, COUNTIF and lookup functionsPivot tables for instant summariesCharts that tell a storyCleaning messy spreadsheet data

Practise

  • Clean a messy sales spreadsheet
  • Analyse monthly revenue by product
  • Calculate product-level performance
  • Build a basic Excel dashboard

The job market, mapped

Top 20 data designations — and what each one actually does.

Job titles in data are confusing: one company's "data analyst" is another's "BI developer". Here's the honest breakdown of the 20 designations you'll see most on job boards — what each role really does and the skills it demands.

#1Entry-friendly

Data Analyst

Turns raw business data into reports, dashboards and answers that guide everyday decisions.

SQLExcelPower BIStatistics
#2Entry-friendly

Business Data Analyst

Connects operational data to management decisions — KPI reporting, trends and stakeholder support across finance, sales and operations.

SQLExcelPower BIBusiness acumen
#3Entry-friendly

Business Intelligence (BI) Analyst

Owns the metrics, reporting logic and dashboards people use to make decisions — not just charts, but trusted numbers.

Power BIDAXSQLData modelling
#4Entry-friendly

Reporting Analyst

Produces the recurring management reports and MIS packs that keep organisations running — a classic first data job.

ExcelSQLPower BIAttention to detail
#5Entry-friendly

MIS Executive

Manages management-information systems and daily/weekly reporting — very common entry point in Pakistani banks, telecoms and factories.

ExcelSQLReportingVBA basics
#6Entry-friendly

Marketing Analyst

Measures campaigns, customer segments and ad performance so marketing budgets are spent where they work.

ExcelSQLDashboardsMeta/Google Ads data
#7Entry-friendly

Financial Analyst

Analyses revenue, costs and forecasts; increasingly expected to know BI tools alongside finance knowledge.

ExcelPower BIForecastingAccounting basics
#8Entry-friendly

Operations Analyst

Finds inefficiencies in supply chains, logistics and day-to-day operations using data.

ExcelSQLProcess mappingPower BI
#9

Product Analyst

Studies how users behave inside apps and websites, runs experiments and guides product decisions.

SQLA/B testingProduct metricsPython
#10Entry-friendly

Junior Business Analyst

Bridges business teams and developers — gathers requirements, documents processes and validates solutions with data.

RequirementsExcelSQL basicsCommunication
#11

BI Developer

Builds the semantic models, warehouses and dashboard systems behind business intelligence — more technical than a BI analyst.

SQLPower BI/TableauData modellingETL
#12

Data Visualization Specialist

Designs the dashboards and visual stories that make complex data understandable at a glance.

Power BITableauDesign principlesDAX
#13

Data Scientist

Builds predictive models and statistical analyses to answer questions dashboards can't — among the fastest-growing occupations worldwide.

PythonStatisticsMachine learningSQL
#14

Machine Learning Engineer

Takes models out of notebooks and into production systems that serve real users at scale.

PythonML frameworksDeploymentSoftware engineering
#15

Quantitative Analyst

Applies advanced statistics and modelling in banking, risk and investment — strong maths required.

StatisticsPythonModellingFinance
#16

AI Analyst

Evaluates, prompts and integrates AI tools into business workflows — a fast-emerging role.

PythonLLM toolsEvaluationSQL
#17

Data Engineer

Builds the pipelines and platforms that move, clean and store data so analysts and scientists can use it.

PythonSQLETL/ELTAirflowCloud
#18

Analytics Engineer

Sits between data engineering and analysis — models clean, tested datasets with tools like dbt.

SQLdbtData modellingGit
#19

ETL Developer

Designs the extract-transform-load jobs that feed warehouses and reports every night.

SQLETL toolsPythonScheduling
#20

Database Administrator (DBA)

Keeps databases fast, secure and backed up — the guardians of an organisation's data.

SQLPostgreSQL/SQL ServerSecurityPerformance tuning

New to data? Start with the roles marked "Entry-friendly" — Data Analyst, MIS Executive and Reporting Analyst are the most realistic first jobs, and our free Data Analyst roadmap covers exactly the skills they ask for.

Get found by recruiters

Optimize your LinkedIn for data roles.

Most data jobs in Pakistan are filled through LinkedIn and referrals — not job portals. A well-optimized profile works for you while you sleep. Follow these ten steps before you send a single application.

Get a free profile review on WhatsApp
  1. 1

    Headline = target role + skills

    Don't write "Student" or "Seeking opportunities". Write "Aspiring Data Analyst | SQL · Power BI · Excel" — recruiters search by keywords, and your headline is the most weighted field.

  2. 2

    Photo & banner that look professional

    A clear, friendly headshot gets far more profile views. Use your banner to show your field — a simple data-themed visual or your tagline.

  3. 3

    About section that tells a story

    Three short paragraphs: who you are, what you've built (projects, dashboards, certificates), and what you're looking for. Write in first person and show numbers where you can.

  4. 4

    Featured section = your portfolio

    Pin your best Power BI dashboard, GitHub repository or capstone project. Recruiters click these before reading anything else.

  5. 5

    Skills & endorsements

    Add SQL, Excel, Power BI, Python and statistics as skills. Endorsements and skill badges improve search ranking.

  6. 6

    Turn on "Open to Work" correctly

    Set it to recruiters-only if you're employed. Add specific titles (Data Analyst, MIS Executive, BI Analyst) and cities including Remote.

  7. 7

    Post your learning journey

    One post per week — a chart you built, a SQL trick you learned, a project milestone. Consistency beats virality; recruiters notice active learners.

  8. 8

    Connect with intent

    Send 10–15 personalised connection requests weekly to analysts, HR and hiring managers in your target cities. Always add a one-line note.

  9. 9

    Custom URL & contact info

    Claim linkedin.com/in/yourname and add your email. Put the URL on your resume — it makes you verifiable.

  10. 10

    Ask for recommendations

    A short recommendation from a mentor, teacher or colleague is social proof no certificate can match.

Free e-book · Career master guide

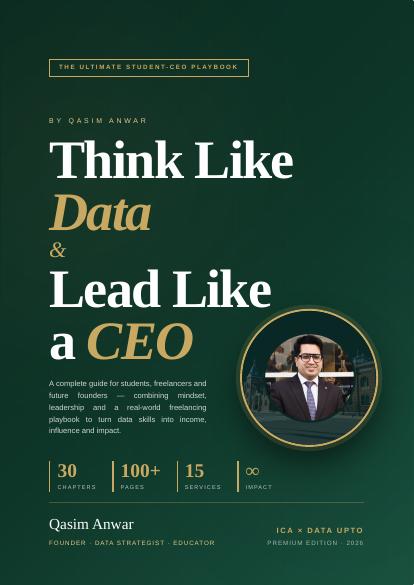
Think Like Data, Lead Like a CEO.

A free career master guide by Qasim Anwar for students, freelancers and future founders — combining a data mindset, real-world leadership and a complete freelancing playbook to turn data skills into income, influence and impact. Just message us on WhatsApp and ask for it.

  • Why data thinkers are the new CEOs
  • The data-thinker mindset: curious, careful, clear
  • Complete Data Analyst freelancing kit for Pakistan
  • Services you can sell with data skills
  • Leadership and decision-making with data
  • Building income, influence and impact as a student
Think Like Data, Lead Like a CEO e-book cover

Learning experience

More than courses. A structured learning experience.

Instructor-led / offline classes

Classroom-based learning — available for selected batches.

Self-paced learning

Recorded lessons and materials you can follow on your schedule.

Mentor support

Ask questions, get project reviews and direction — available on mentor-supported plans.

Practical projects

Hands-on assignments built around real-world business data.

Career preparation

Interview practice, resume reviews and portfolio guidance.

Inclusions vary by program and batch.

A DataUpto class learning data analysis on live dashboards
A mentor guiding a student through Python data analysis

Professional training programs

Learn with structure, mentors and projects.

Every program fee is a single one-time payment — no monthly instalments, no hidden charges. Launch discounts are live now.

48% OFF

Data Analyst Program

PKR 6,250PKR 12,000

~$22 instead of ~$43 · one-time payment

For
Beginners, graduates and career switchers
Duration
3 months
Format
Instructor-led (selected batches) · Self-paced · Mentor-supported
Project
3 portfolio projects incl. a published Power BI dashboard
Mentor
Project reviews and Q&A with mentors
Certificate
Certificate details confirmed per batch
ExcelSQLStatisticsPower BITableau introPython basics
53% OFF

Data Scientist Program

PKR 7,500PKR 16,000

~$27 instead of ~$57 · one-time payment

For
Analysts, STEM students and programmers
Duration
4–5 months
Format
Instructor-led (selected batches) · Self-paced · Mentor-supported
Project
Applied ML capstone deployed as a live demo
Mentor
Weekly mentor guidance and capstone review
Certificate
Certificate details confirmed per batch
PythonStatisticsSQLEDAMachine learningModel deployment
50% OFF

Data Engineer Program

PKR 12,500PKR 25,000

~$45 instead of ~$89 · one-time payment

For
Developers, IT graduates and technical analysts
Duration
Up to 6 months
Format
Instructor-led (selected batches) · Self-paced · Mentor-supported
Project
End-to-end pipeline from API to warehouse
Mentor
Architecture reviews with mentors
Certificate
Certificate details confirmed per batch
Advanced SQLPythonData modellingETL/ELTAirflow & dbtCloud basics

Simple pricing: one payment covers the whole program. Message us on WhatsApp for the current fee and next batch date.

Free learning ecosystem

Start learning before you spend a rupee.

Everything below is free and needs no account.

0

career roadmaps

0

dataset sources

0

interview questions

Explore the Free Learning Library
Students exploring data dashboards together
Python data analysis notebook with charts

Projects & portfolio

Turn knowledge into proof.

Employers trust what you can show. Explore project ideas by career path and difficulty.

Beginner

Retail sales analysis

Clean a year of transactions in Excel and present monthly trends and top products.

Intermediate

Customer purchasing behaviour

Use SQL to find repeat buyers, basket size and churn signals.

Intermediate

Executive sales dashboard

A Power BI report with KPIs, drill-through and regional filters.

Intermediate

Marketing campaign EDA

Use pandas to compare campaign channels and recommend budget shifts.

Know what to expect before the interview.

ExcelSQLPythonPower BIStatisticsMachine learningData engineeringBusiness scenariosBehavioural
Start Interview Preparation

Build a resume that shows what you can do.

A free, clean, ATS-friendly template for data roles. Fill it in, preview it live and download as PDF — your details never leave your browser.

Create My Resume

Business services

Need better data, better leads, or better business decisions?

A partner for educational institutes, academies, training companies and growing businesses — with special focus on the education sector.

Data analytics & reporting

Business audits & process analysis

Lead generation

Meta Ads for education businesses

Performance reporting & optimisation

Qasim Anwar, founder of DataUpto

Qasim Anwar

Founder & Head of Learning and Development, DataUpto

Meet the founder

The mind behind every roadmap.

Qasim Anwar is the founder and Head of Learning and Development at DataUpto. Every DataUpto roadmap — Data Analyst, Data Scientist and Data Engineer — is designed by him, built around what students actually need to move from zero to job-ready.

Alongside teaching, he is a customer experience specialist who works hands-on in lead generation, marketing, advertising, branding and consumer behaviour, and has worked across many business segments throughout the year.

He is also the owner of Learn Analytics and ICA (icanapply.com), and the author of the career master guide “Think Like Data, Lead Like a CEO”.

Learning & DevelopmentCustomer ExperienceLead GenerationMarketingAdvertisingBrandingConsumer BehaviourData Analytics

DataUpto

Founder · Head of L&D

Learn Analytics

Owner

ICA · icanapply.com

Owner

Talk to Qasim

Our story

How DataUpto is changing lives.

DataUpto started with a simple observation: talented people across Pakistan were stuck — not because they lacked ability, but because nobody showed them the path. Scattered tutorials, confusing advice, and courses that taught tools without teaching careers.

So we built the thing we wished existed: a clear roadmap from "I don't know where to start" to "here is my portfolio, and I'm ready for the interview." Students who once found spreadsheets intimidating now build dashboards for real businesses. Career switchers from banking, telecom and teaching are rewriting their professional stories — one skill, one project, one confident interview at a time.

That's what "Learn. Build. Analyze. Grow." means to us — not a slogan, but the journey we walk with every learner.

Student voices

Reviews from our learners.

From banking to telecom, from Gujranwala to Karachi — hear from the people learning with us. Every review published here comes from a real student.

Language
City
Sector

The first reviews are on their way.

We only publish real reviews from real students — no invented ratings, no stock testimonials. As our current batches share their experiences, this wall will fill up with their stories, in their own words and languages.

Your next step doesn't have to be complicated.

Choose a career path, explore the free roadmap, and start building the skills that move you forward.

Follow for roadmaps, interview tips, workshop announcements & student projects